After posting about what Library Twitter accounts are doing here and here, I stumbled upon a more efficient way of getting the statistics and this resulted in the following batch of statistics (Number of followers, Number of following, Followers/following ratio, Age of account (based on first tweet) and total updates for all 456 accounts on the Library Twitter League.
And as luck would have it, at the same time the Twitter League was updated and you can now, get the very same statistics as well from there! You can now order by not just followers, but also following , follower/following ratio, signup date and alphabetical. In any case, the data will be used in this post.
Is the list representative of Library Twitter accounts?
No doubt, many people will have questions about how representative the list is. As mentioned here ,the list began from self-reported cases from here , here and here . I was somewhat concerned that this list has an inherent bias in listing mature accounts, so I searched using Twitter search using “Lib”, “library”, “ref” etc as well as directories such as wefollow and tried as best as I could to add obvious library accounts.
Nevertheless, I can’t rule out the fact that the sample here isn’t representative, though I submit that 456 is a large sample and is probably a good starting place as any.
Descriptive statistics
Image may be NSFW.
Clik here to view.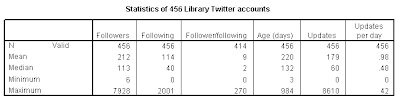
You will notice from the results above that the mean and median number of followers, 212 and 113 respectively is a bit different compared to what was reported in an earlier post (the mean was lower, but median was higher in earlier smaller sample), mainly because the composition of accounts in the earlier batch was quite different (earlier calculations had left out a few big accounts, while excluding numerous smaller accounts).
Age of account
A new statistic we have is the age of the account based on first tweet in days. The oldest account is 984 days old, or over 2.5 years old, making it one of the pioneer accounts. But 50% of accounts are younger than 132 days old (roughly 4 months), showing a surge in many new accounts.
Image may be NSFW.
Clik here to view.
Above shows the cumulative distribution graph of Library Twitter accounts by age (days).
Total updates
Image may be NSFW.
Clik here to view.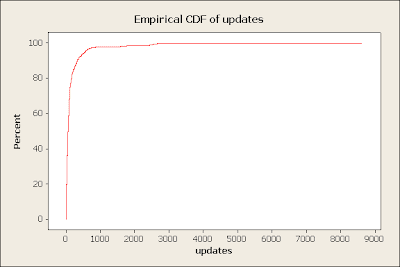
95% of library Twitter accounts have updated less than 1,000 times but this does not take into account the age of accounts.
Updates per day
Image may be NSFW.
Clik here to view.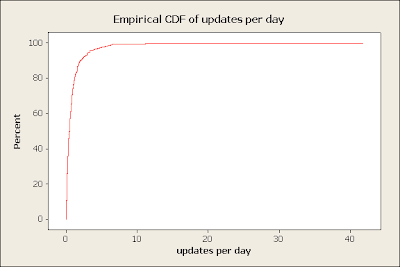
It was obvious also to calculate updates per day, and generally library Twitter accounts don’t update much with a mean update of 0.98 updates per day.
The twitter library accounts generally don’t update a lot. 95% of accounts update less than 3 times daily. Note that update per day is calculated by taking total updates divided by the age of the account. Some accounts are dormant for a while before they become really active, so this statistic probably understates the current updates per day.
TFF ratio
One statistic, I calculated in an earlier blog post was Twitter follower/following ratio or more formally named Twitter Follower-Friend Ratio (TFF)
I was curious, what the typical TFF ratio of library accounts was. Did Library twitter accounts follow everyone who followed them as recommended here? Did they embark on a strategy to proactively follow identified users and hence had TFF ratios below 1?
As noted in earlier post, proactively identifying people who are your users allows and following them, allows you to proactively respond to them even if they are not directed to you, and even if they just say “library” without mentioning the name of your library.
For all 458 library twitter accounts the following pie chart shows the distribution below
Image may be NSFW.
Clik here to view.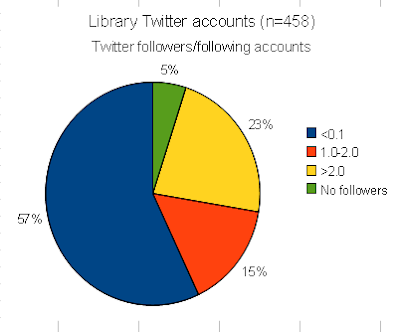
It seems that a majority (57%) of Library Twitter accounts have less followers then those following them! 5% had no followers and the rest had more followers than following.
As we have seen in an earlier blog post, this result differs quite a bit when we only consider the top 100 Library Twitter accounts (based on following size) as shown below. In particularly, only 15% of the top 100, have TFF ratios of below 1 (see below).
Image may be NSFW.
Clik here to view.
In a sense this is not surprising. The sample of all 458 Twitter accounts, includes many accounts just starting out, and they might be still in a “growth” stage or some may be initially employing a strategy of following many accounts to build up reciprocal relationships?
Bio of Twitter accounts followed
What type of accounts are library Twitter accounts following? The following word cloud of the bios of the followers of a Library in Oklahma (via Twittersheep) is quite typical.
Image may be NSFW.
Clik here to view.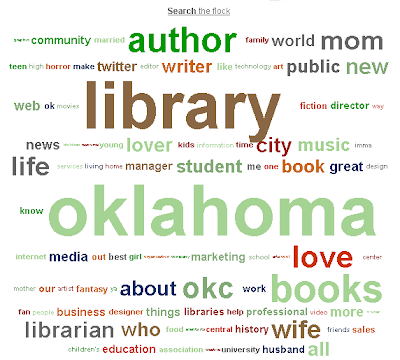
Libraries Twitter account seems to be following Libraries, Librarians, writers and probably “book lovers”, and of course people in Oklahma.
Image may be NSFW.
Clik here to view.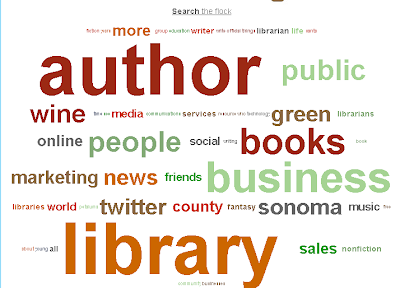
Another typical account showing that this Library like to follow authors.
Correlation analysis
Finally did a little bit of correlation analysis
Image may be NSFW.
Clik here to view.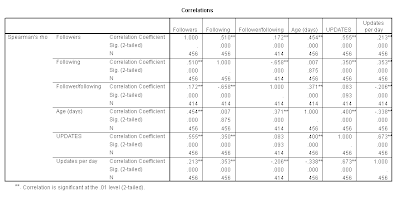
Results
1) As expected age of account is highly positive correlated with number of followers. Number of those following is not correlated with age.
2) Number of followers is highly and positively correlated with TFF ratios.
It seems to me that, at least for the library twitter accounts, larger follower accounts are correlated with high TFF ratios (low number of following relative to followers). Probably the biggest most famous accounts such as Library of Congress, New York Public Library by virtue of their reputation gain huge number of followers automatically and do not need to build up their following by reciprocal following.
3) As expected age of account is correlated with total number of updates.
4) Updates per day is correlated with Followers and followings.
Obviously there is quite a bit of co-linearity.
Multi-linear regression – what explains number of followers
Ran a quick regression analysis
Multi-linear regression (stepwise) was carried out with number of followers as the dependent variable, and the other statistics as independent variable.
Image may be NSFW.
Clik here to view.
The final model, has a adjusted R-square of 0.567.
It indicates that number of followers is explained by increased number of followings, follower/following ratio, age (in days) and updates per day.
Is this model useful? Just putting it out there. Probably requires a larger range of independent variables.